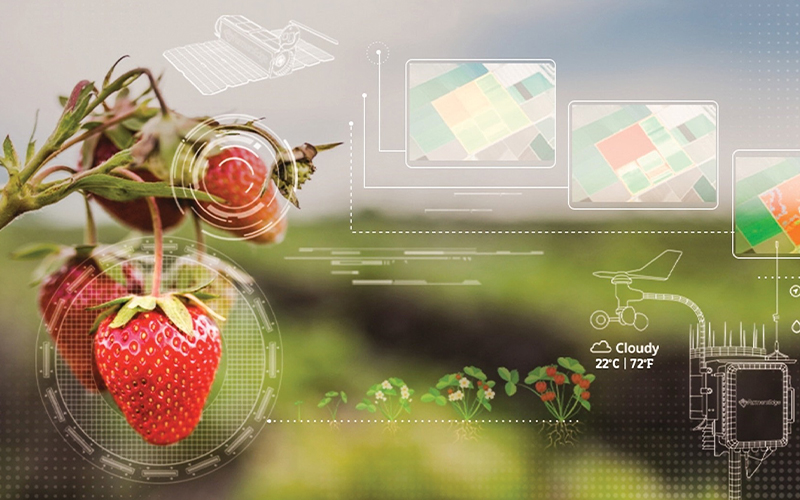
Satellite monitoring is the missing link in a successful agribusiness chain. _The use of satellite data and online analytical services can fill the gaps in routine audit methods.
They allow you to quickly get and assess information on any field. With all the best planning, recommendations, and crop management practices, there’s still nothing that replaces empirical, on-farm data. A huge bonus is that the analysis of historical satellite images enables you to keep an even closer watch on your fields and catch problems you may not otherwise have seen.
These solutions have unrivaled advantages – they are cheaper and allow you to monitor large areas for a long time. Accounting of previously collected data opens the door to the creation of historical field maps. Data-driven decisions like a field productivity map created by examining archived images for the spring-summer periods of past years can convert your whole farm into a testing ground and give confidence in the practices you are adopting. This will give you the most return on investment. These are the benefits that top the list of satellite monitoring capabilities.
Using them, the auditors will receive a tool to assess the real value of the land. And agro holdings will have the opportunity to account for their land bank, identify areas for “smart” fertilization, and much more. Furthermore, you have to consider that during the growing season, you are making key decisions that will have a direct impact on your final yield results.
Crop Monitoring is a universal tool for all the players of the Agro market as you can find the field health monitoring, climate impact analysis, fertility management, and crop yields modeling tools at a one-for-all Platform. It’s hard to know how decisions are paying off without a reliable way of measuring results, so:
- Farmers can use the platform to monitor weather conditions for minimizing related risks, plan and manage field works, prevent their field losses, use powerful analytic tools like vegetation indices (you can select the period for analysis) for proper decision making and to be on the forefront of farming technology with yield prediction;
- Insurers can get easy access to the field’s historical data, farming records, or land usage without visiting the field as these can be monitored directly in the platform;
- Traders can assess region attractiveness for safer transactions on the supply of crops, improve their logistics plans, track the land usage, predict yields to estimate their future income expenses, and monitor weather conditions to prevent crop failure.
Monitor Your Fields In Browser
It allows the farmer to automate the process of monitoring and efficiently manage both- a small farm and a large agribusiness enterprise. The platform allows you to fulfill a large scope of tasks – from farming to insurance and trading issues. In addition to a comprehensive assessment of the field, the platform also provides farmers with the weather forecast, fertilizer maps – coming soon, a spot problematic areas analysis, which significantly reduces the costs.
In addition, the platform provides farmers with field condition maps based on vegetation indices analytics for the field. The indices currently available: NDVI, NDRE, MSAVI, Reel, and NDMI (EVI, SAVI, ARVI, CCI, NDWI- coming soon). Due to the availability of historical data on the NDVI, EOS Crop Monitoring provides complete information on such plants as canola, com, wheat, sunflower, soybeans, beetroots, and peas. Yes, the world loves peas and even beetroots – and they’re big business. Another feature of the platform is a comparison of the field indicators with averages over the area. This feature allows you to determine how the crops are vegetating compared with the same crops within a given area that is, you can see whether you are the coolest farmer in the region.
The product’s functionality also includes the ability to classify cropping areas and visualize them on the map.
Scouting – Set, Arrange, Synchronize, And Track the Performance of Your Tasks.
The module for scouting allows you to set a task directly in the Crop Monitoring system. The procedure is as follows: you specify the CPS-coordinates of the field and add the description of the issue needs to be solved. The scouting task goes directly to the mobile application. Once the task is opened in the application, it’s marked as a point on the field. The expert goes to the field, takes pictures and gives feedback on the state of the crops. All data is saved, and as soon as access to the Internet appears, the information is downloaded by default, so that you can proceed with it offline. The tasks performance can be monitored in the system and the results can be downloaded as an Excel file.
EOS Crop Monitoring Mobile App
The mobile app provides functions just like the web version, it is easy to use and constantly improving. Particular attention deserves the interface of EOS Crop Monitoring. It is user-friendly and easy-to-integrate into ERP and CRM systems. The app is provided in three languages – English, Ukrainian, and Russian.
Weather Data
Last, but not least is a monitoring of weather conditions. Constant updating of meteorological information with early weather forecasting, which comprises precipitation, air temperature, humidity, wind speed, as well as the depth of snow can deliver value to your business. It allows to know the critical weather conditions that can directly affect the vegetation of crops in advance, and take all the necessary precautions timely. An important advantage of the system is the ability to receive notifications of ‘Winter kill’, ‘Cold stress’, and ‘Heat stress’ immediately after the issue occurred. Analyzing historical weather data allows you to look more deeply inside your fields so you can stay one step ahead.
Comments are closed.